From Footfall to Forecast: The Digital Twin Playbook for Optimizing Retail Store Layouts
You’ve spent a fortune on the perfect store location and a stunning fit-out, but your sales per square foot are flat. You're relying on gut feelings and last year’s sales data to decide where to place your most valuable products. Making a layout change is a high-stakes gamble—it’s expensive, disruptive, and you won’t know if it worked for months. There is a better way to de-risk these critical decisions.
This playbook shows you how to use a digital twin—a dynamic virtual replica of your store—to test, simulate, and validate layout changes *before* you spend a single dirham. We’ll give you a framework to connect store design directly to revenue, moving from guesswork to data-driven certainty.
Key Takeaways
- De-Risk Fit-Out Costs: A/B test multiple store layouts virtually to find the optimal design for customer flow and sales, avoiding costly physical trial-and-error.
- Increase Sales per Square Foot: Use simulation data to strategically place high-margin products in traffic hotspots, boosting profitability without increasing footprint.
- Optimize Staffing & Queues: Predict customer bottlenecks during peak hours (like a DSF flash sale) and simulate new queue systems or staff placements to reduce wait times and abandoned baskets.
- Validate Promotional Displays: Test the placement and impact of new promotional displays in your digital twin to forecast their effect on basket size before you even build them.
- Prove ROI with Hard Numbers: Connect simulation results directly to your POS and CRM data to build a clear business case showing how layout changes drove a measurable lift in revenue.

Stop Guessing: Why Traditional Layout Planning Fails
For decades, retail operators have relied on a mix of experience, basic footfall counters, and static planograms. This approach is no longer enough. In a competitive market like Dubai, where every square foot of retail space is immensely valuable, these methods leave money on the table. They can't answer crucial questions in real-time:
- How does moving a key display affect the customer’s path through the rest of the store?
- Where do shoppers hesitate or get frustrated?
- If we set up a pop-up display for a new fragrance, will it cannibalize sales from our existing beauty section?
Answering these requires a dynamic, data-rich environment where you can test hypotheses safely. That environment is a digital twin, a core component of building a true AI workforce for your operations.
The Scan, Simulate, Sell Framework for Retail Optimization
A digital twin isn't just a 3D model; it's a living lab. It integrates data from your physical space to create a replica you can experiment with. We developed this three-step framework to make the process practical and ROI-focused.
Step 1: Scan (Build Your Data Foundation)
First, you capture your store and map your data sources. The goal is to create a high-fidelity model that understands both the physical space and the business context. A thorough scan is the foundation for accurate simulations.
Your Data Capture Checklist:
- Physical Space Scan: Use tools like Matterport or NavVis to create a dimensionally accurate 3D model of your store. This captures everything from shelf height to aisle width.
- Footfall & Movement Data: Integrate real-time data from IoT sensors (like Density or Voxel) or existing security cameras to map how customers *actually* move through the space. This goes beyond simple door counts to reveal popular zones and dead spots.
- Sales & Transaction Data: Connect your Point-of-Sale (POS) and CRM systems (like HubSpot or Salesforce) via API. This allows you to link specific locations in the store to transaction values and customer segments.
- Inventory & Product Data: Overlay your inventory management system to map which products are on which shelves.
Ready to see it in action? Book a 15-minute demo to map the ROI of a digital twin for your flagship store.
Step 2: Simulate (Ask and Answer Smarter Questions)
With your digital twin built, you can now run experiments that would be impossible or disruptive in real life. Instead of asking "I wonder what would happen if...", you can get a data-backed forecast. This is where you test your biggest assumptions safely.
Example Scenarios to Simulate:
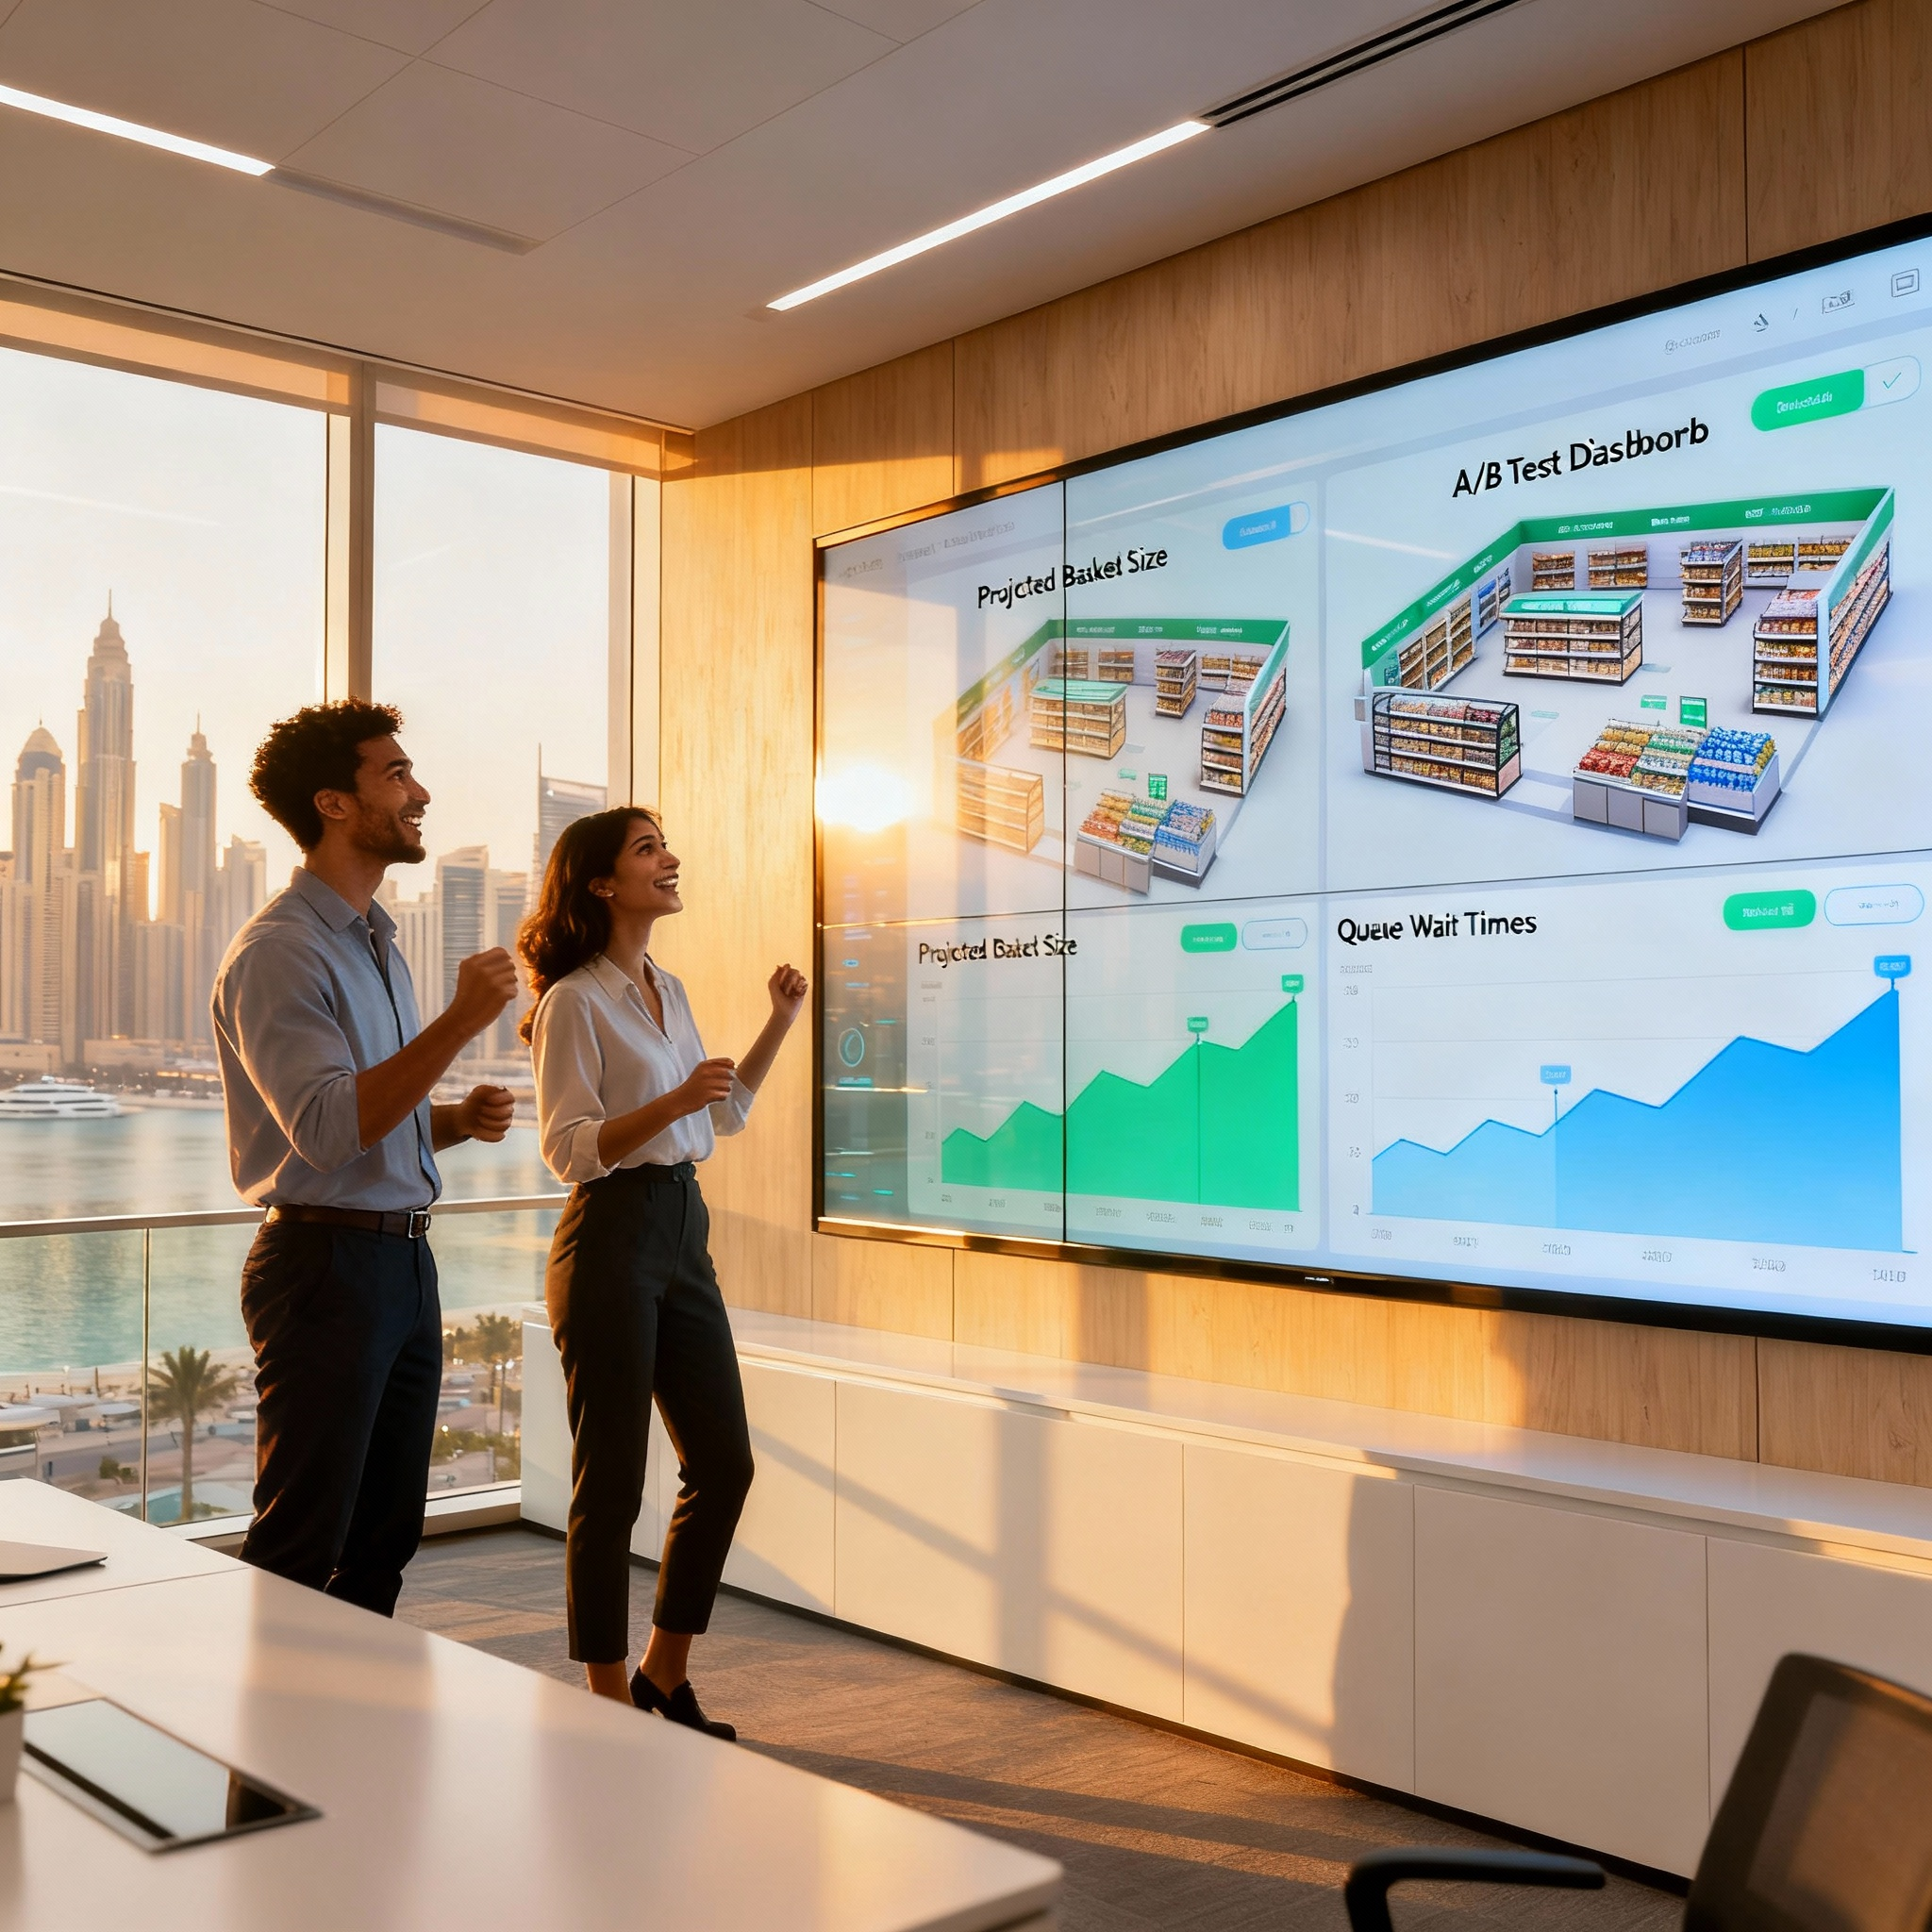
- Promotion A/B Test:
- Hypothesis: Moving the "2-for-1" accessories table closer to the main entrance will increase average basket size.
- Simulation: Run two models. Model A uses the current layout. Model B uses the new layout. Simulate 10,000 customer paths for each.
- Result: The simulation predicts Model B increases basket size by 8% but slightly increases checkout queue times. Now you can make an informed tradeoff.
- Queue Management Test:
- Hypothesis: A single-serpentine queue will be more efficient than three separate cashier lines during peak hours.
- Simulation: Model both queue systems under high-traffic conditions based on last year's holiday sales data.
- Result: The serpentine queue reduces the average wait time by 90 seconds, leading to a projected 2% reduction in abandoned baskets.
This process transforms your operational strategy from reactive to predictive, a key goal we also explore when measuring ROI for phygital events.
Step 3: Sell (Connect Virtual Insights to Real-World Sales)
The final step closes the loop. After a successful simulation guides a physical change, you must measure the actual impact against the prediction. This proves the value of the digital twin and builds a case for further investment.
The ROI Proving Ground: Before & After
Let's say a simulation predicted that moving your premium denim section to a brighter, more central location would increase its sales by 15%. You make the change.
After 30 days, you pull the real-world data from your POS system:
| Metric | Simulation Prediction | Actual 30-Day Result | Outcome |
|---|---|---|---|
| Premium Denim Sales Lift | +15% | +18% | Success |
| Average Dwell Time (in zone) | +45 seconds | +52 seconds | Success |
| Sales of Adjacent Products | +3% | -1% | Needs Review |
In this example, the primary goal was a huge success and even outperformed the forecast. The data also surfaced an unintended consequence—a slight dip in adjacent product sales. This is an invaluable insight you can feed back into the twin to refine the layout further. This is the power of a living, learning model of your business.
Frequently Asked Questions (FAQ)
- 1. How can a digital twin improve my store's profit?
- By allowing you to test and validate changes to store layout, product placement, and staffing *before* implementation. This increases the success rate of your initiatives and directly boosts metrics like sales per square foot and average basket size.
- 2. What is the cost of a retail digital twin in Dubai?
- Costs vary based on store size and data complexity. A pilot project for a single flagship store is the best starting point to prove ROI. It involves initial scanning costs and a recurring fee for the simulation platform and data integration. The business case is built on delivering a return far greater than the investment through optimized sales.
- 3. How can I test product placement before launching?
- A digital twin is the ideal tool. You can create a virtual model of a new product display, place it in different locations within your simulated store, and run virtual customers past it to predict engagement, dwell time, and impact on sales of nearby items.
- 4. What is the best way to analyze customer flow in a store?
- While traditional heatmaps are useful, a digital twin provides a much richer analysis. It integrates real-time sensor data to show not just where customers go, but their complete paths, how long they linger, where bottlenecks form, and which areas are being underutilized.
- 5. How can AI predict customer behavior in a physical store?
- AI powers the simulation engine of the digital twin. By analyzing historical data on customer paths and purchases, the AI can build predictive models. When you propose a layout change in the simulation (e.g., moving a shelf), the AI forecasts how different customer segments are likely to react.
- 6. How do I measure the ROI of a new store layout?
- Use the "Sell" stage of our framework. First, benchmark your key metrics (sales per square foot, conversion rate, etc.) for 30-60 days. Then, implement the new layout. Measure the same metrics for the next 30-60 days. The percentage change in performance, correlated with the cost of the change, gives you your ROI.
- 7. How long does it take to implement?
- A pilot for a single store can be up and running in a few weeks. The initial 3D scan is quick (often done overnight), and data integration depends on your existing systems. The expert team at Future & Happiness manages this technical lift.
Your First Steps to a Smarter Store
Moving from instinct-based decisions to a data-driven retail lab is more accessible than you think. You don't need to overhaul your entire operation overnight. Start small, prove the value, and scale what works.
- Audit Your Data: Identify what data sources you already have. Do you have reliable footfall data? Is your POS data clean and accessible? Knowing your starting point is key.
- Define One Key Question: Don't try to solve everything at once. Pick one high-value problem. Is it a bottleneck at checkout? Is a specific category underperforming? Focus your pilot project on answering that single question.
- Map Your Potential ROI: Before you commit, work with a specialist to build a simple business case. Estimate the potential lift from solving your key problem and compare it to the project's cost.
This approach systematically removes risk and builds momentum. It’s the first step to turning your physical store into your most intelligent sales asset.