
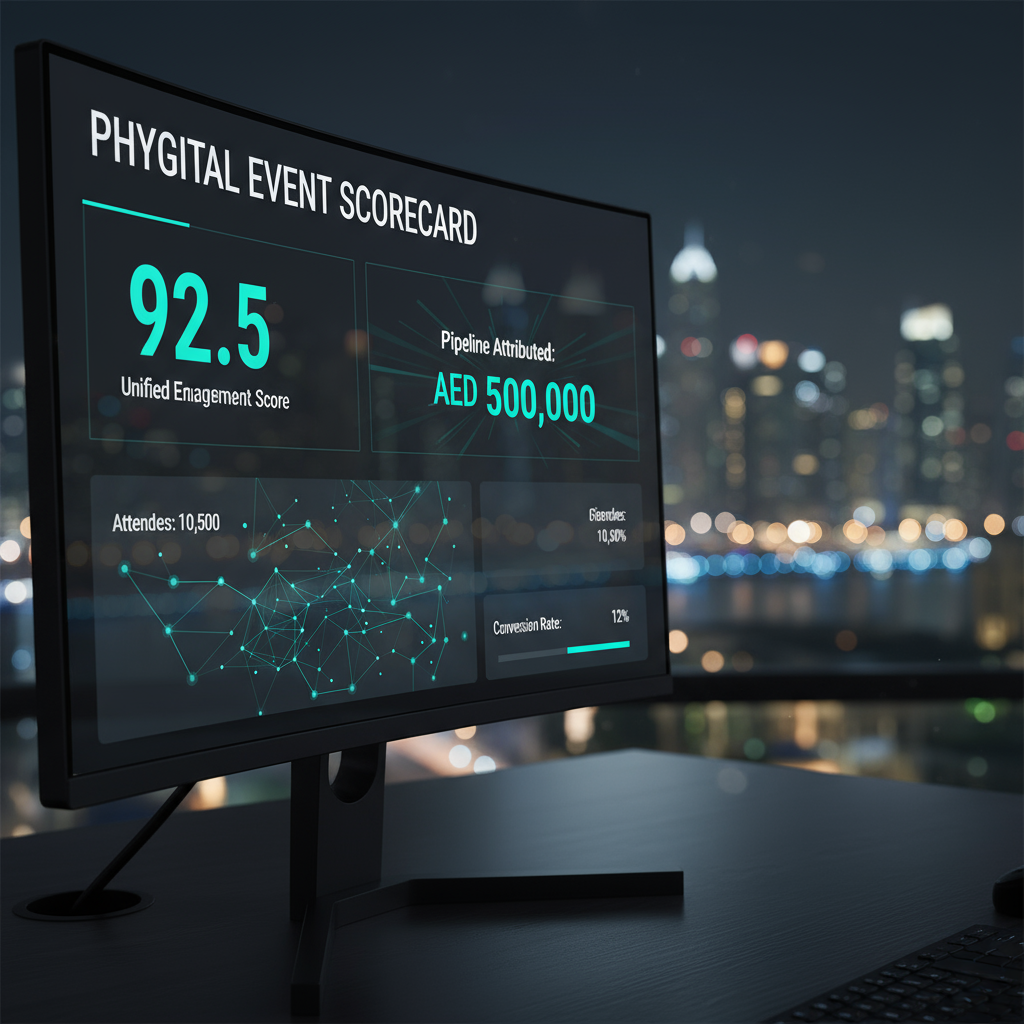
The Phygital Event Scorecard: A Step-by-Step Framework for Measuring ROI Beyond Footfall and Clicks
You hosted a fantastic hybrid event. The Dubai venue was buzzing, and the virtual platform saw thousands of logins. But when your CFO asks, "What was the ROI?" you're stuck patching together two different stories: physical footfall from turnstiles and virtual clicks from a dashboard. This fragmented view makes it impossible to prove the true value of your investment, leaving you guessing instead of knowing.
It’s time to stop guessing. This guide provides a unified framework to measure the combined impact of your physical and digital event strategies. We'll show you how to connect every handshake and every click directly to your sales pipeline, giving you a single, defensible ROI number.
Key Takeaways
- Unified Engagement Score: Learn to calculate a single metric that combines physical dwell time, QR code scans, virtual session attendance, and poll responses for a complete view of audience interaction.
- Smarter Lead Scoring: Go beyond just collecting names. We'll show you how to score leads based on their specific phygital journey, separating the curious browsers from the high-intent prospects.
- Direct Pipeline Attribution: Discover how to use automation tools like n8n to connect event interactions directly to deals in your CRM, proving exactly how much revenue your event generated.
- Dubai-Ready Framework: Get a cost-benefit analysis template tailored for the UAE market, factoring in local vendor costs and compliance considerations.
- Actionable Tech Stacks: See how to integrate tools like visitor tracking sensors, HubSpot, and automation platforms to create a seamless data pipeline from the event floor to your bottom line.
Why Old Event Metrics Are Failing You
Traditional event measurement was simple. For physical events, you counted attendees and leads collected. for virtual, you tracked logins and chat messages. In the phygital model—where attendees move fluidly between a physical venue and a digital interface—these siloed metrics are useless. They can't tell you if the attendee who scanned a QR code at a booth is the same person who later watched a product demo in the event app. Without that connection, you can't understand the full customer journey or accurately calculate your cost per acquisition.
This data gap leads to weak reporting and shaky budget justifications. To fix this, you need a new system: The Phygital Event Scorecard.
The 4-Part Phygital Event Scorecard Framework
This framework is designed to give you a single source of truth for your event's performance. It’s a practical, step-by-step model that connects every interaction to a measurable business outcome.
1. Calculate a Unified Audience Engagement Score
First, stop thinking in terms of separate "physical" and "virtual" attendees. Your goal is to measure the engagement of each *participant*, regardless of the channel they use. A unified score helps you understand who was truly captivated by your content.
Here’s a simple formula to start with:
(Dwell Time Score) + (Interaction Score) + (Virtual Session Score) = Total Engagement Score
- Dwell Time Score: Use NFC badges or passive sensors to measure how long an attendee stays at a specific booth or zone. (e.g., >10 mins = 10 points).
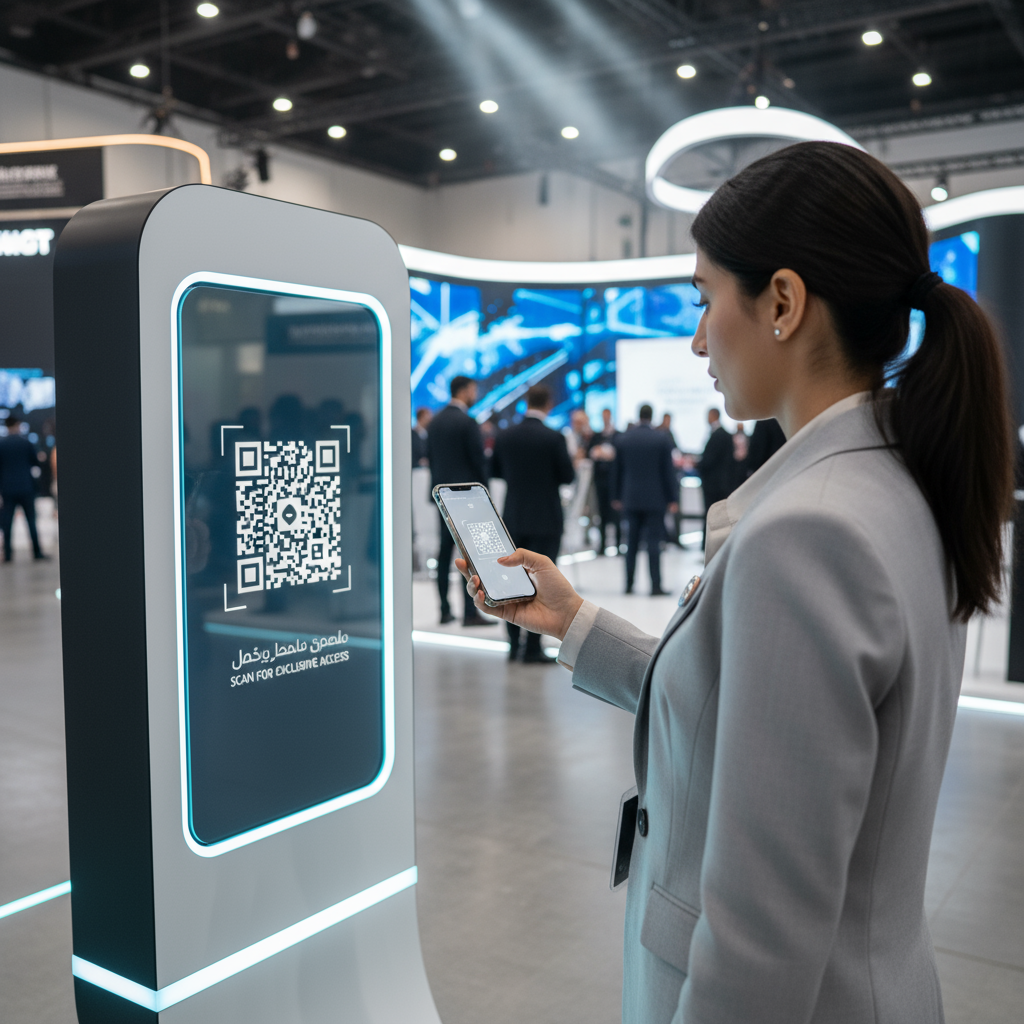
- Interaction Score: Assign points for high-intent actions like scanning a product QR code (15 points), participating in a poll (5 points), or speaking to a sales rep (20 points).
- Virtual Session Score: Award points for attending a live-streamed session (10 points), downloading resources (5 points), or asking a question in the Q&A (10 points).
This turns vague interest into a hard number, allowing you to identify your most engaged participants instantly.
2. Implement Dynamic Lead Quality Scoring
Not all leads are created equal. A person who simply gets their badge scanned is very different from someone who attends three sessions and scans a "Book a Demo" QR code. Your scoring should reflect this reality.
Here's a before-and-after transformation:
- Before: You have 500 "leads." All are sent the same generic follow-up email. Your sales team wastes hours filtering through low-quality contacts.
- After: Using the engagement score, you segment those 500 leads. The 75 with scores over 40 are flagged as "High-Intent" and receive a personal call within 24 hours. The rest are entered into an automated nurture sequence. Result: Your sales team’s follow-up efficiency increases, and demo bookings climb by 22% in the first month.
This approach helps you focus sales efforts where they'll have the most impact.
See the Scorecard in Action. Book a 15-minute demo to map your next event's phygital ROI framework.
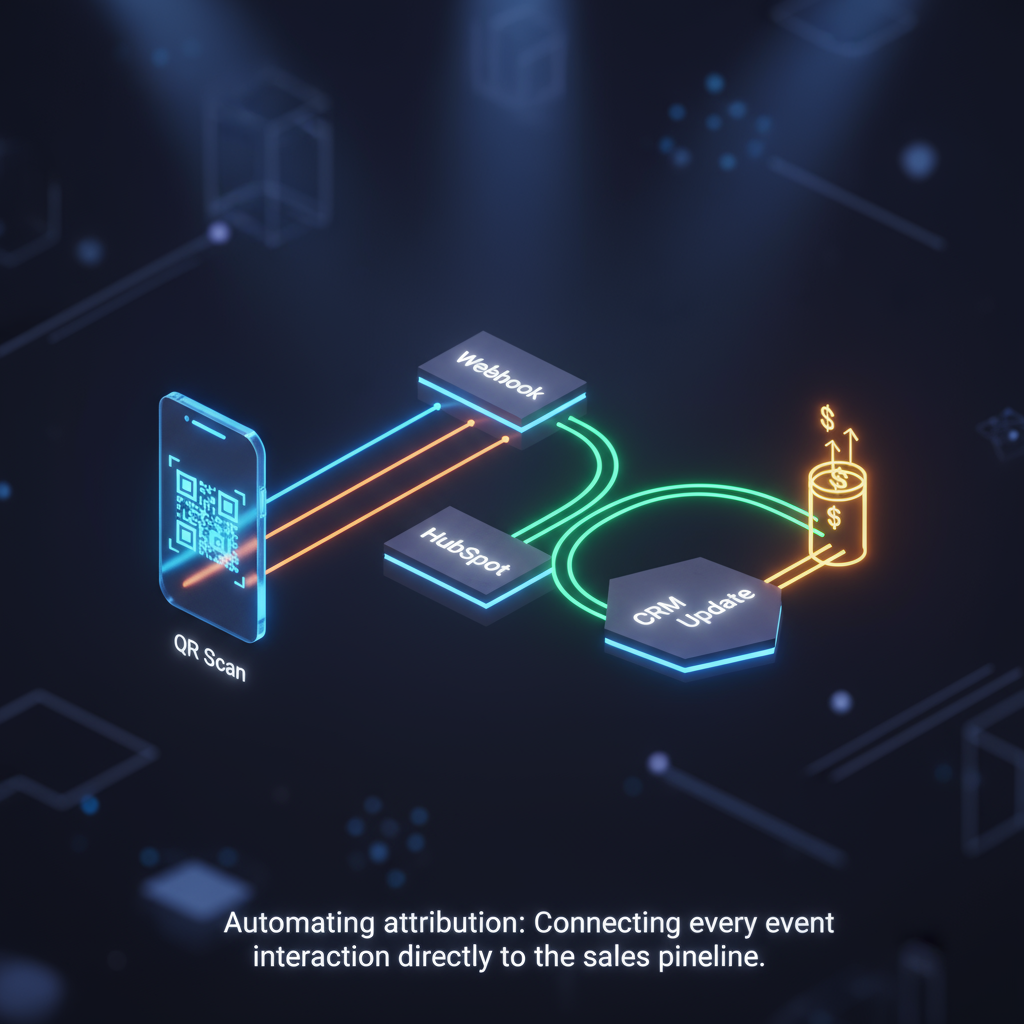
3. Master Pipeline Attribution with Automation
This is where you connect your event directly to revenue. The key is to create an unbroken data chain from the event interaction to the deal in your CRM. Manual data entry won't work—it's slow, error-prone, and can't scale.
Here’s a checklist to wire this up using a tool like n8n or Make.com:
Checklist: Linking Event Actions to CRM Pipeline
- Use Unique Identifiers: Ensure every QR code, NFC tag, and registration link contains a unique UTM source tag (e.g., `utm_source=gitex2025&utm_campaign=booth_demo`).
- Set Up a Webhook Listener: Configure your event app or QR code generator to send data to an n8n webhook every time an action occurs.
- Wire the Automation Workflow: In n8n, create a workflow that receives the data, formats it, and then searches for the contact in your HubSpot or Salesforce CRM via their email address.
- Update the Contact Record: If the contact exists, update their record with the event activity (e.g., "Scanned Product A QR Code"). If they don't exist, create a new contact with the appropriate lead source.
- Associate with a Deal: When a sales rep creates a new deal for that contact, the event interaction is already on their timeline, providing clear attribution.
By automating this process, you can finally tell your stakeholders, "This event directly influenced AED 500,000 in new sales pipeline." We at Future & Happiness specialize in building these kinds of automated systems.
4. Build a UAE-Focused Cost-Benefit Analysis
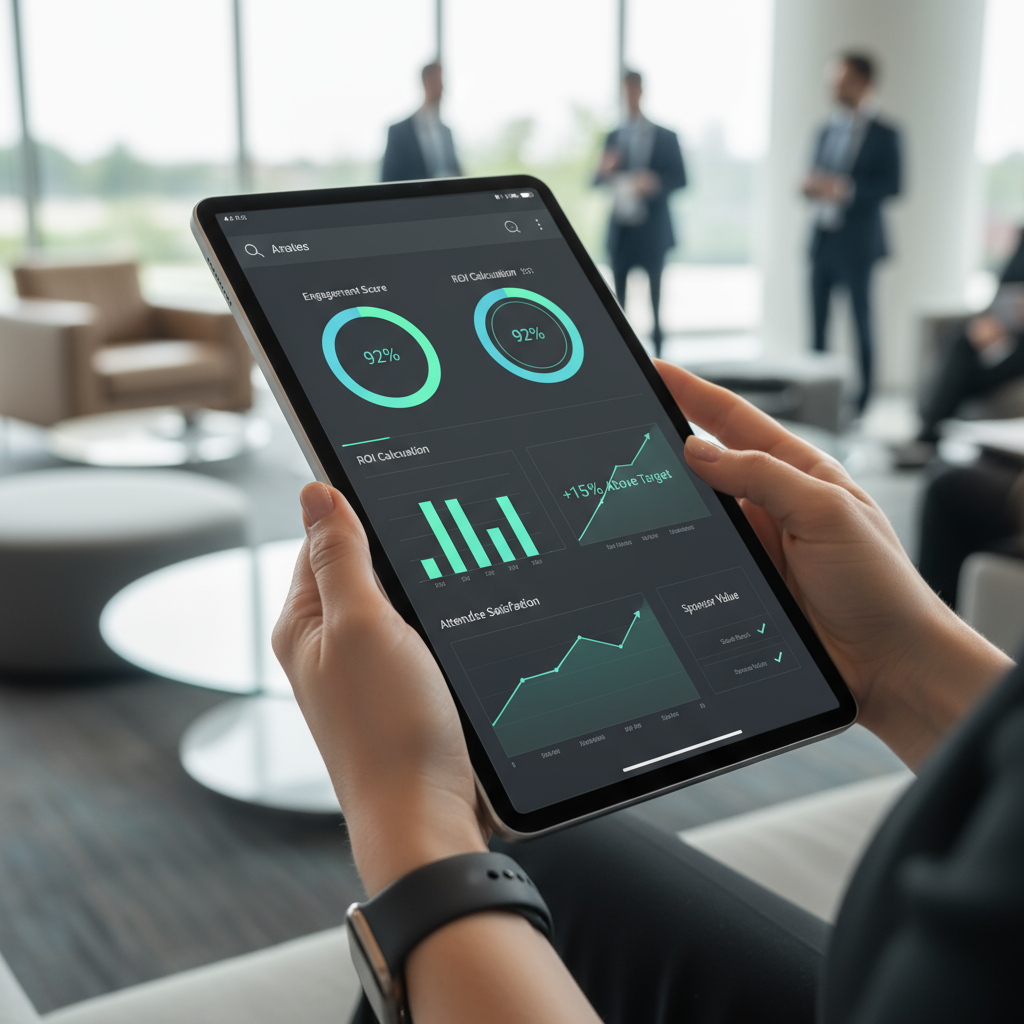
The final step is to weigh the total investment against the attributed pipeline and other objectives. Your scorecard needs a clear financial breakdown.
Here’s a simple table to structure your analysis:
| Cost Category (AED) | Amount | Benefit Category | Value (AED) |
|---|---|---|---|
| Venue & Booth Rental (DWTC) | 150,000 | Directly Attributed Sales Pipeline | 500,000 |
| Staffing & Travel | 50,000 | Qualified Leads (MQLs) Generated (x150) | 75,000 |
| Virtual Platform & Tech Stack | 40,000 | Brand Impressions / Media Value | 25,000 |
| Marketing & Promotion | 30,000 | - | - |
| Total Investment | 270,000 | Total Value | 600,000 |
This simple format makes the ROI calculation transparent. For this example, the Return on Investment is (600,000 - 270,000) / 270,000 = 122%. That's a number your board will understand and appreciate. Automating post-event follow-up can further improve these numbers, a concept we explore when we build an AI workforce.
Frequently Asked Questions (FAQ)
- How do you measure the success of a hybrid event?
- Success is measured by unifying physical and digital metrics into a single scorecard. Track a combined Audience Engagement Score, attribute leads directly to sales pipeline using automation, and calculate a clear ROI by comparing total event cost to the financial value generated.
- What are the KPIs for a phygital event?
- Key Performance Indicators (KPIs) include: Unified Engagement Score, Lead Quality Score (based on phygital interactions), Pipeline Attribution Rate, Cost Per Acquisition (CPA), and overall Event ROI. Avoid vanity metrics like raw registration numbers.
- How do I calculate cost per acquisition for an event?
- Divide your total event investment (including venue, tech, staff, and marketing) by the number of new customers acquired as a direct result of the event. For example, an AED 270,000 investment that results in 27 new customers gives you a CPA of AED 10,000.
- What is a good lead conversion rate for a trade show?
- This varies by industry, but a common benchmark is for 5-10% of qualified leads from a trade show to convert into closed deals. With a phygital scoring model, you can significantly improve this by focusing sales efforts on the highest-quality leads.
- How to track audience engagement in a hybrid model?
- Use an integrated tech stack. Deploy NFC/RFID for physical tracking, ensure your virtual platform has robust analytics, and use QR codes as a bridge. Then, pipe all this data into a central system (like a CRM via n8n) to build a single engagement profile for each attendee.
- What is the difference between event ROI and ROO (Return on Objective)?
- ROI (Return on Investment) is a purely financial metric that measures how much profit an event generated compared to its cost. ROO (Return on Objective) measures success against non-financial goals, such as brand awareness, thought leadership, or partner development.
- How can I prove event ROI to my boss?
- Present a clear, one-page scorecard that shows the total investment, the sales pipeline directly attributed to the event, the calculated ROI percentage, and the Cost Per Acquisition. Use visuals and focus on the financial impact, not just activity metrics.
- Best tools for measuring event engagement?
- A modern stack includes: Data Capture (QR codes, NFC/RFID tags), CRM (HubSpot, Salesforce), and Automation (n8n, Make.com) to connect everything. The power isn't in one tool, but in how you integrate them.
Your Next Steps to Measuring True Event ROI
Moving from fragmented data to a clear, defensible ROI is achievable. You don't need a massive budget, but you do need a structured approach. Stop guessing and start measuring what matters.
- Audit Your Current Tech Stack: Identify your primary tools for registration, virtual events, and your CRM. Where are the data silos?
- Design Your First Scorecard: Use the framework above to define the engagement actions and scores that matter for your specific event. Keep it simple to start.
- Map Your First Automation Workflow: Pick one high-value interaction (like a "Request a Demo" QR scan) and build an n8n workflow to connect it to your CRM.
- Benchmark and Iterate: Run this system at your next event, measure the results, and refine the scorecard for the future.
By implementing this phygital scorecard, you'll finally have the data to not only justify your event budgets but also to optimize them for maximum impact.